Profitable on Paper: How to Spot the Gap in Your Financials
Most leaders learn to read financials the way most people learn to drive: well enough to get somewhere, not well enough to notice when the odometer has been running while the car was parked.
The P&L shows the distance traveled. It does not always show who was driving.
This post is about the gap between those two.
I am a Certified Fraud Examiner. I have spent years sitting across from people who could not figure out why their numbers felt wrong. Smart people. Often very successful people. People who had built real companies and knew their industry cold. They understood their business. They just did not know what to look for when someone inside that business was quietly redirecting value elsewhere.
The data I am drawing from here comes from the Occupational Fraud 2026: A Report to the Nations, published by the Association of Certified Fraud Examiners. This is not a think piece based on theories. It is based on 2,402 documented fraud cases investigated by CFEs between January 2024 and September 2025 across 143 countries. Real organizations with real losses. And executives who signed off on financials that looked fine until they didn’t.
The most common story nobody tells at the boardroom table
The fraud type most leaders never worry about is the one that shows up in 90% of cases.
Asset misappropriation: an employee steals or misuses the organization’s resources. It is the least dramatic category. No elaborate accounting schemes, no falsified financial statements. Someone takes something. Equipment goes missing. Expenses get reimbursed that were never incurred. Vendor payments flow to entities that exist only on paper.
The median loss from asset misappropriation schemes sits at USD 100,000. Not catastrophic for a large company. Potentially existential for a small one.
Corruption follows at 45% of cases, with a median loss of USD 150,000. This one tends to live in procurement decisions, vendor selection, and contract awards. The person making the choice has a reason to make it that has nothing to do with the organization’s interests. The reason is usually financial and usually invisible to everyone above them.
Financial statement fraud is the rarest, appearing in only 6% of cases. It is also the most expensive, with a median loss of USD 1,000,000. This is the category that collapses companies and ends careers. It is rare precisely because it requires deliberate, sustained, coordinated effort. Most organizations never get there. They stop earlier, at the level of asset misappropriation, and never realize it.
Size does not protect you the way people think it does
The comfortable assumption that fraud scales with organizational size is exactly that: comfortable. The data from 2,402 cases across 143 countries does not support it.
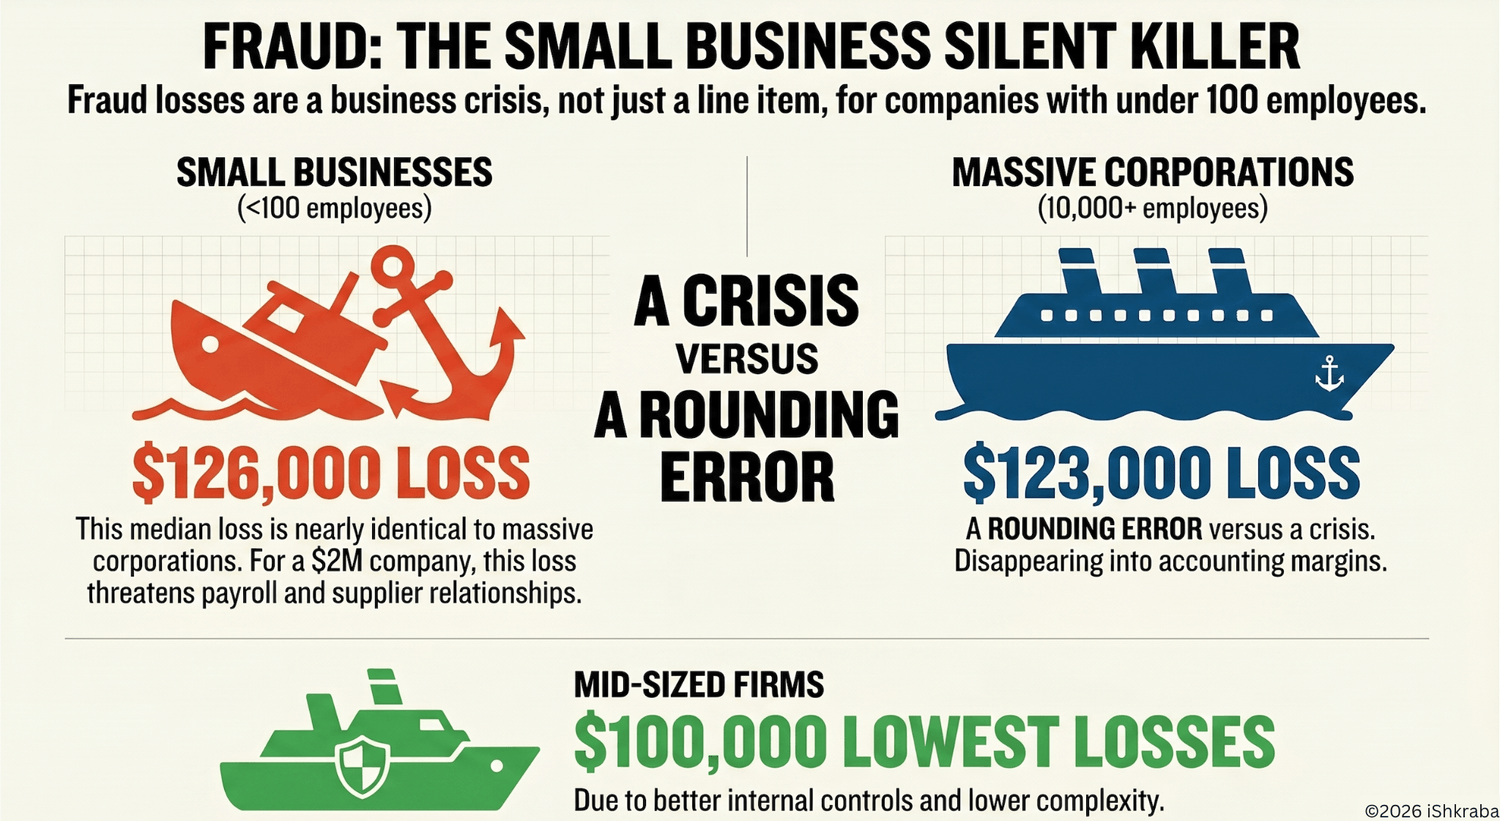
Data from Report to the Nations 2026, Association of Certified Fraud Examiners, visualization by the author
The median fraud loss at organizations with fewer than 100 employees is USD 126,000. At organizations with 10,000 or more employees, it is USD 123,000.
Those numbers are nearly identical. What is not identical is what USD 123,000 means to each of them.
For the small company, that loss touches payroll, supplier relationships, credit lines. For the large one, it disappears into rounding. The exposure is the same. The consequences are not.
[Access 8 financial metrics that 90% of leaders overlook when assessing their earnings]
The pattern worth noting: occupational fraud risk across organization sizes is far more uniform than most leaders expect. The idea that fraud is someone else’s problem, specifically the problem of organizations larger or more exposed than yours, is a very comfortable idea with very little basis in the evidence.
Industry context matters, and not always in the direction you would expect
The industries with the highest median losses are often not the ones that make headlines.
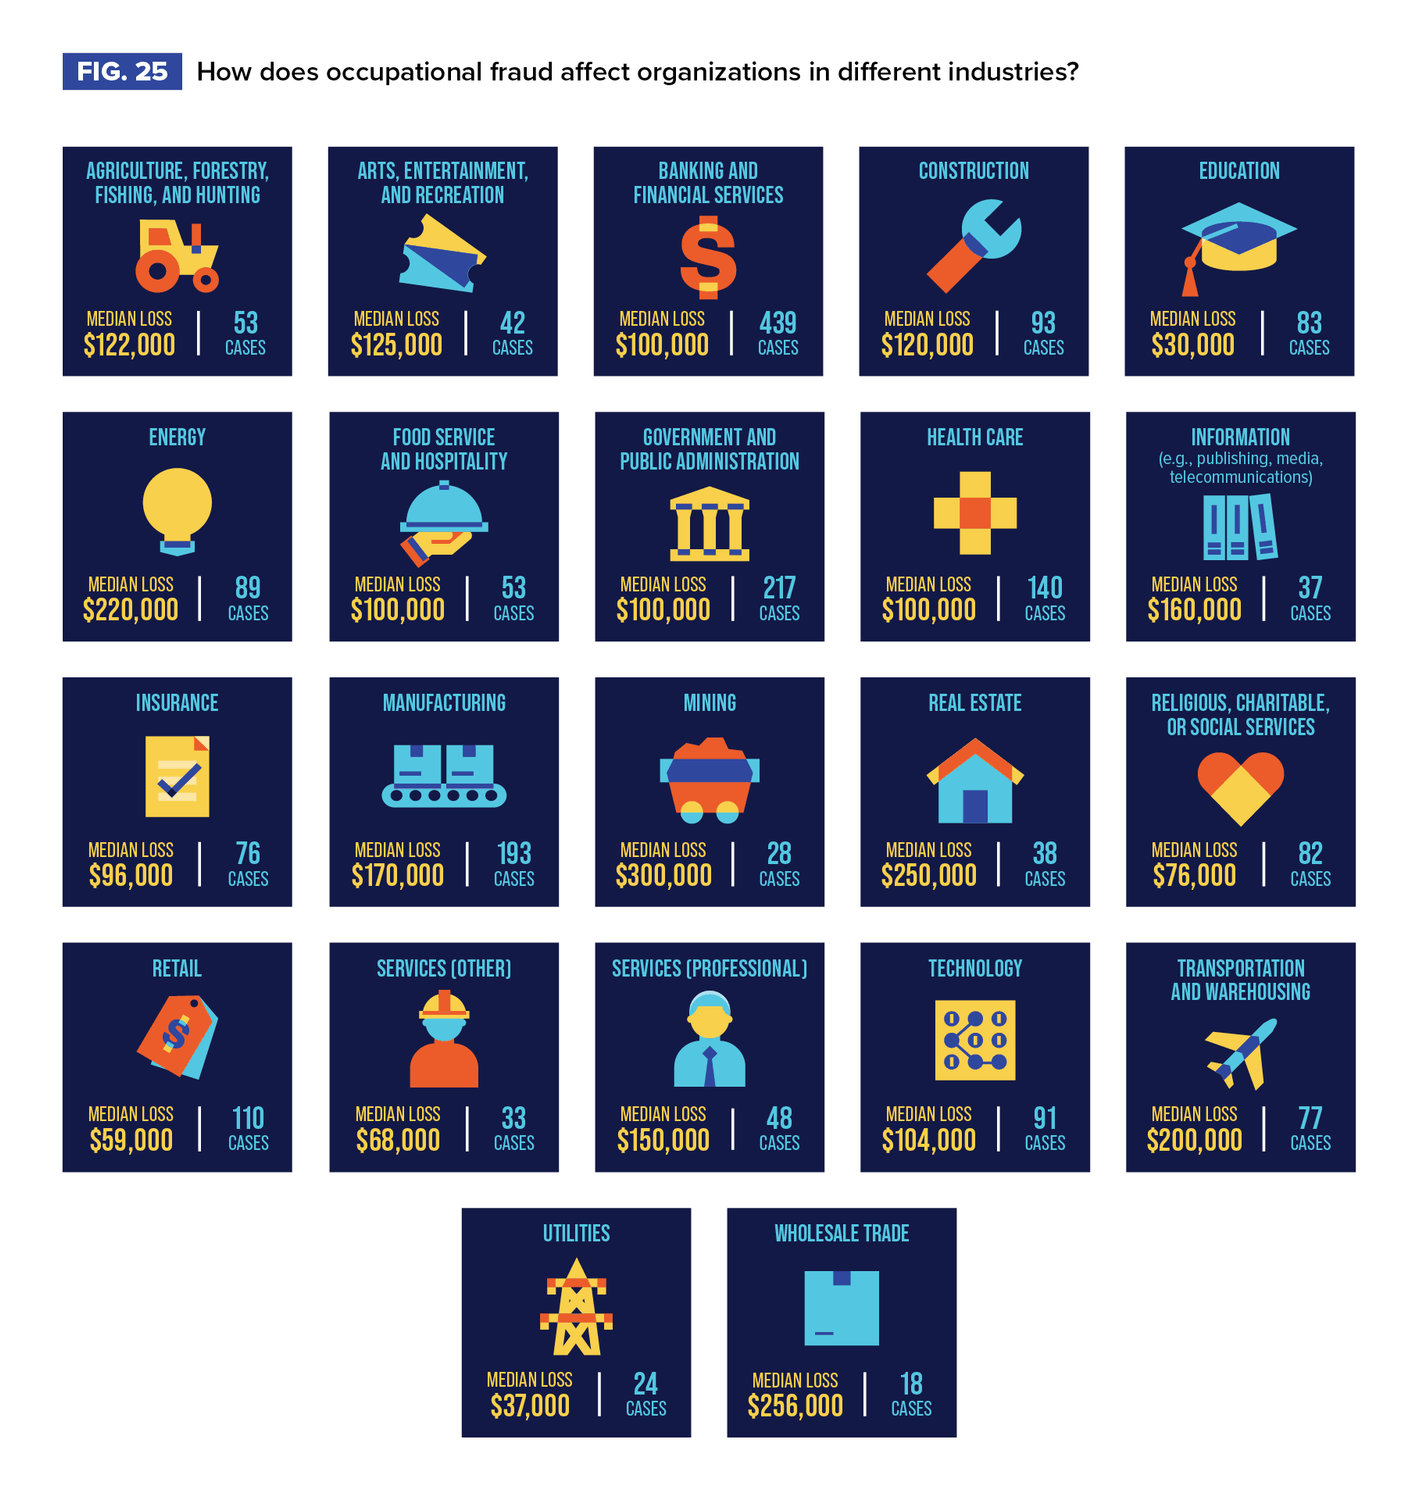
From Report to the Nations 2026, Association of Certified Fraud Examiners
Mining, Wholesale Trade, and Real Estate carry the highest median losses, at USD 300,000, USD 256,000, and USD 250,000 respectively. None of them are industries people typically associate with sophisticated financial fraud.
Banking and Financial Services sits at USD 100,000 across 439 documented cases, which is the highest case volume in the dataset. The controls are there, so is the volume.
The industry-specific fraud exposure picture is worth understanding for one practical reason: sector norms shape what behaviors get normalized and what red flags get ignored because they look like standard practice.
The language your financials actually speak
Most financial statements are read as a performance record. They are also a behavioral one, and that second reading tends to be more revealing.
A healthy business shows Net Cash Flow and Net Profit moving in the same direction. When those two lines start diverging without a clear operational explanation, something is worth examining.
Production costs growing faster than output is worth a question.
ROI systematically landing below project forecasts is worth a question.
The organizations that catch problems early tend to be the ones where leaders ask questions before the pattern becomes undeniable.
What incentive structures actually produce
This is where the behavioral layer becomes important.
When more than 70% of a manager’s compensation depends on short-term revenue targets, incentive misalignment in financial reporting becomes almost inevitable. The system stops rewarding performance and starts rewarding the appearance of performance.
People do not typically decide one morning to act dishonestly. The shift is gradual and almost invisible from the inside. Forecasts get rounded up a little. Pipeline gets inflated a little. Revenue recognition stretches to the edge of what is defensible, then slightly past it. Each step feels marginal. Collectively, they create a meaningful gap between what the business reports and what it actually generates.
The consequence is predictable. Artificially inflated performance eventually meets reality. When it does, the losses show up directly on the balance sheet. What started as a bonus calculation becomes a liability. And often, by the time it becomes visible, the person who created it has moved on.
The system is rewarding the wrong behavior, and the numbers are showing the cost.
What most leaders actually look at, and what they miss
The standard set of financial metrics that executives review regularly: revenue, EBITDA, gross margin, headcount costs. These are lag indicators. They show what already happened. They are useful for understanding where the business has been. They are less useful for understanding where value is currently leaving.
The metrics that tend to catch problems earlier are the ones that track relationships between numbers rather than the numbers themselves.
They require a different set of questions being asked of the same data that already exists.
A note how the leak is discovered
In the 2026 ACFE data, tips remain the most common detection method. Not audits or automated controls. But someone inside the organization noticed something and told someone.
This means that the single most effective fraud prevention tool most organizations have is also the most underinvested: a culture where people feel safe naming what they see.
Controls matter. Audits matter. The technical apparatus of financial oversight matters significantly. And none of it performs as well as a workforce that believes something will actually happen if they report a concern.
Organizations that combine strong controls with a genuine reporting culture tend to catch problems earlier, at lower loss amounts, and with more recoverable situations than organizations that rely on controls alone.
[Access 8 financial metrics that 90% of leaders overlook when assessing their earnings]
What changes when leaders read financials differently
The leaders who catch financial problems early share a specific habit. They treat the numbers as a behavioral record, not just a performance record. Revenue is a decision, as cost.
Every line on a P&L represents a series of choices made by people with specific incentives, specific pressures, and specific access to the organization’s resources.
Reading the financials through that lens does not require suspicion. It requires curiosity. The difference between a business that identifies a USD 100,000 problem in month three and one that discovers a USD 1,000,000 problem in year two is often not the presence or absence of controls. It is the habit of asking what a number actually represents before accepting it as a clean data point.
The data from 2,402 real cases across 143 countries is consistent on this: organizations that lose the most tend to be the ones where the gap between reported performance and actual performance grew slowly, over time, in plain sight of the financials.
The numbers are there. You need to read them as a question.
Yours truly,
Irina
The toolkit Profitable (not only) on Paper: How Business Leaders Find Hidden Losses, Spot Financial Red Flags and Protect Their Profit covers the methodology for reading financial statements from a loss-prevention perspective, the control structures that protect margins, and a framework for identifying the behavioral signals that precede most financial losses. If the patterns described in this post feel familiar, the toolkit is a practical place to start.
[Access 8 financial metrics that 90% of leaders overlook when assessing their earnings]